Reporting
Performance Split A-B Testing with PageSpeed
After you have been running an experiment for 24 hours Analytics will have results for you. The screenshots below walk through the process of creating a custom report to view them.
Set up advanced segments
- Advanced segments let you label fractions of your traffic. To view speed results broken down by experiments you need to add segments for each experimental group. Click here to import a segment for a sample experimental group.
-
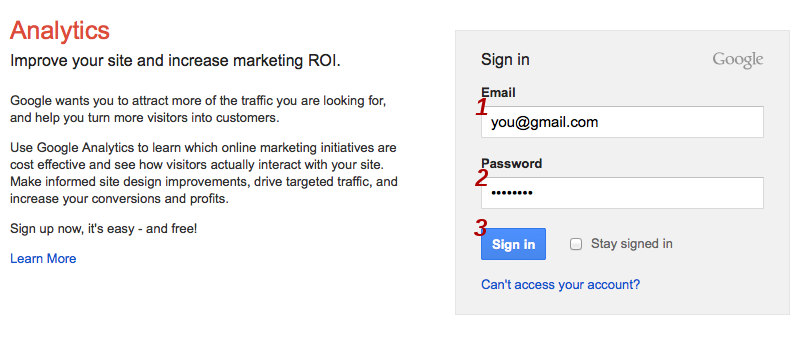
If prompted, log into Google Analytics:
-
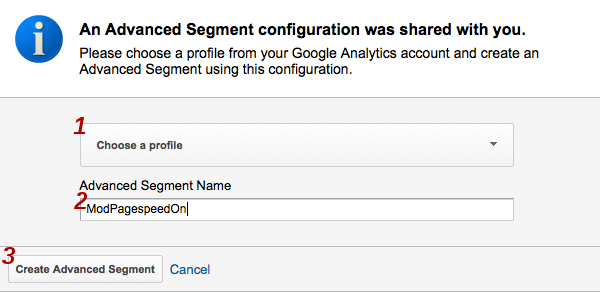
Select the profile that your experiment data was collected under, enter a name for the segment, and click Create Advanced Segment:
-
On the next screen you can adjust this custom segment to fit your situation. If you used a custom variable slot other than the default, which is 1, change Custom Variable (Key 1) and Custom Variable (Value 01) to the appropriate values. Where it says Experiment: 1 replace 1 with the experiment id you used. If you are using version 1.6.29.3 or later, you also need to change FuriousState to ExperimentState.
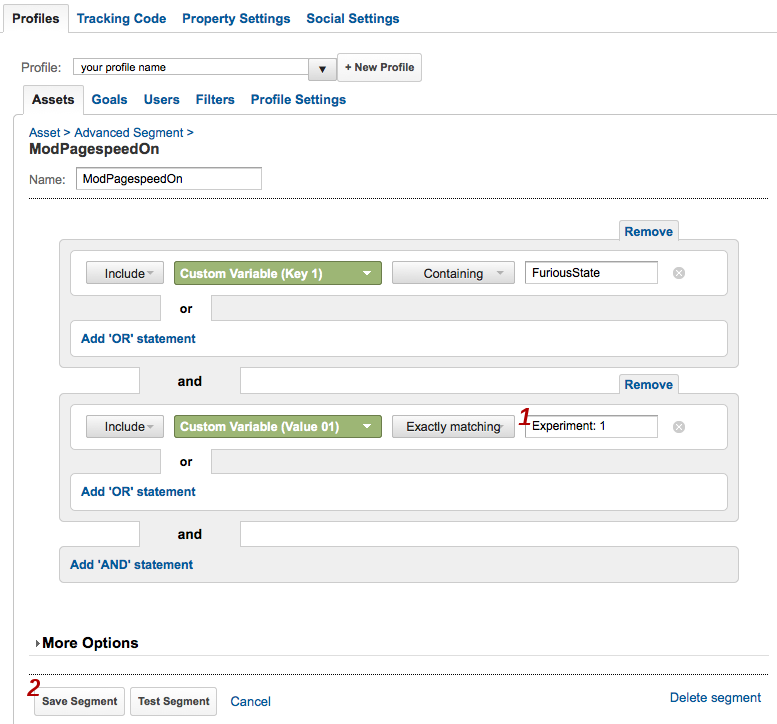
- Click Save Segment.
- Repeat these steps for the rest of your experiment ids.
Add advanced segments to the speed report
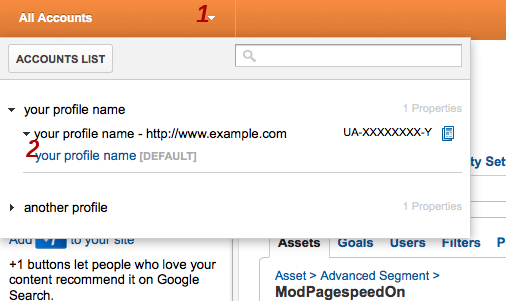
- Click All Accounts.
-
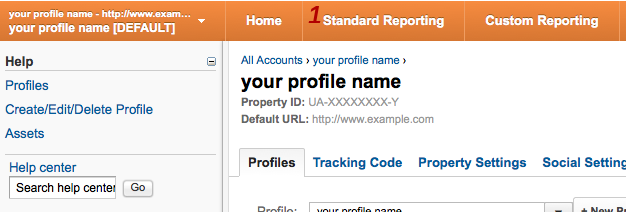
On the dropdown menu click the name for your profile. In the screenshot below this is labeled your profile name [DEFAULT].
-
Click Standard Reporting:
-
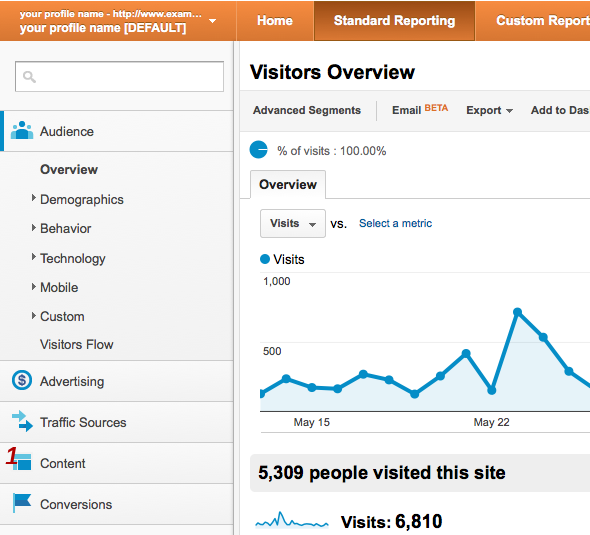
Click Content
-
Under Content click Site Speed and then Page Timings to bring up the Site Speed Page Timings page:
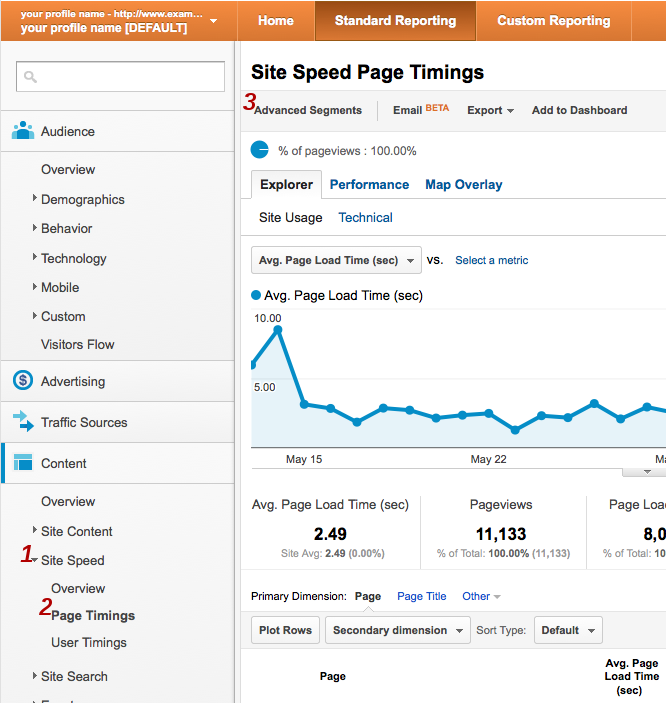
- Click Advanced Segments.
-
Under Custom Segments you will see the segments you added above. Check the boxes next to them and click Apply:
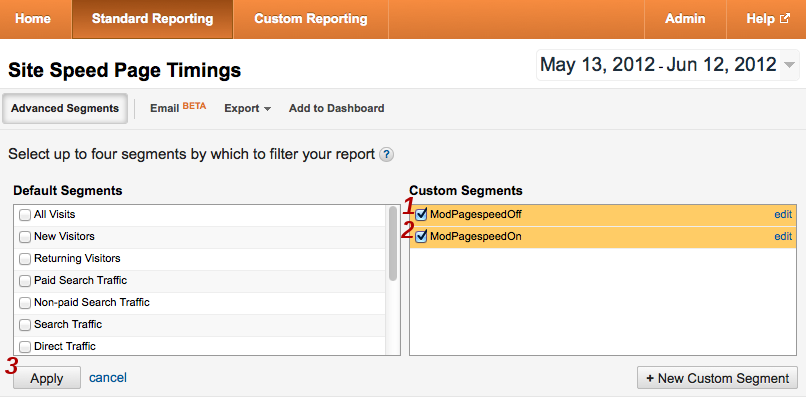
- This takes you to back to the Site Speed Page Timings page.
Examine experimental results
-
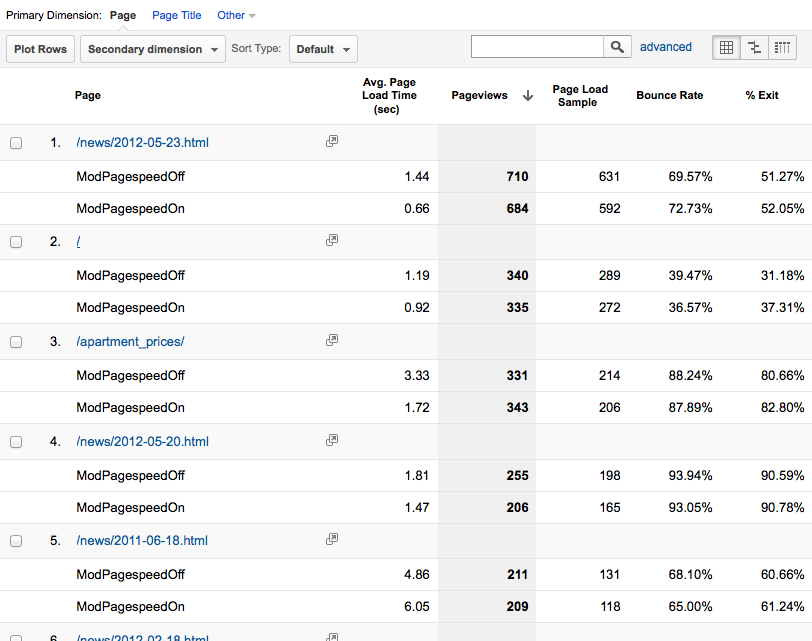
The Explorer tab shows average timing information both overall and, below, per-url:
-
Averages can be misleading, however, because one user who suffers abnormally high latency before the onload event will have an outsize effect on the average. Unless your sample is very large, such users can make an experiment falsely appear to be a success or failure. To overcome this problem a histogram is helpful. Click the Performance tab to see page load times grouped into intervals.
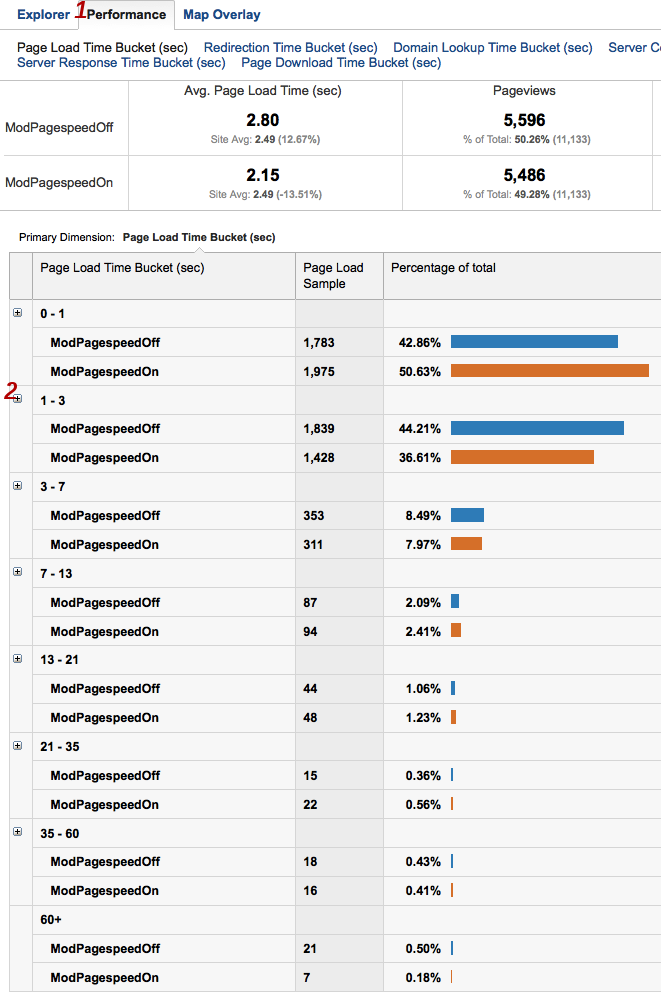
- To see more fine grained timing detail, click the + icon next to any histogram interval to expand it.
- In this experiment PageSpeed appears to have moved about 8% of visits from the 1-3 second category to the 0-1 second one. For a simple mostly-text site running only the core set of filters, this is a reasonable result. As a next step the webmaster of this site might examine the optimizations list to determine if there are filters that are not in the core set which might be good targets for future experimentation.